Market Briefing · April 2026
SoCal Luxury Real Estate:
What the Numbers Look Like Right Now
Every few weeks, a snapshot of active luxury inventory across four Southern California coastal markets — because understanding what the market is actually doing is useful whether you’re buying, waiting, or investing from the sidelines.
At a Glance
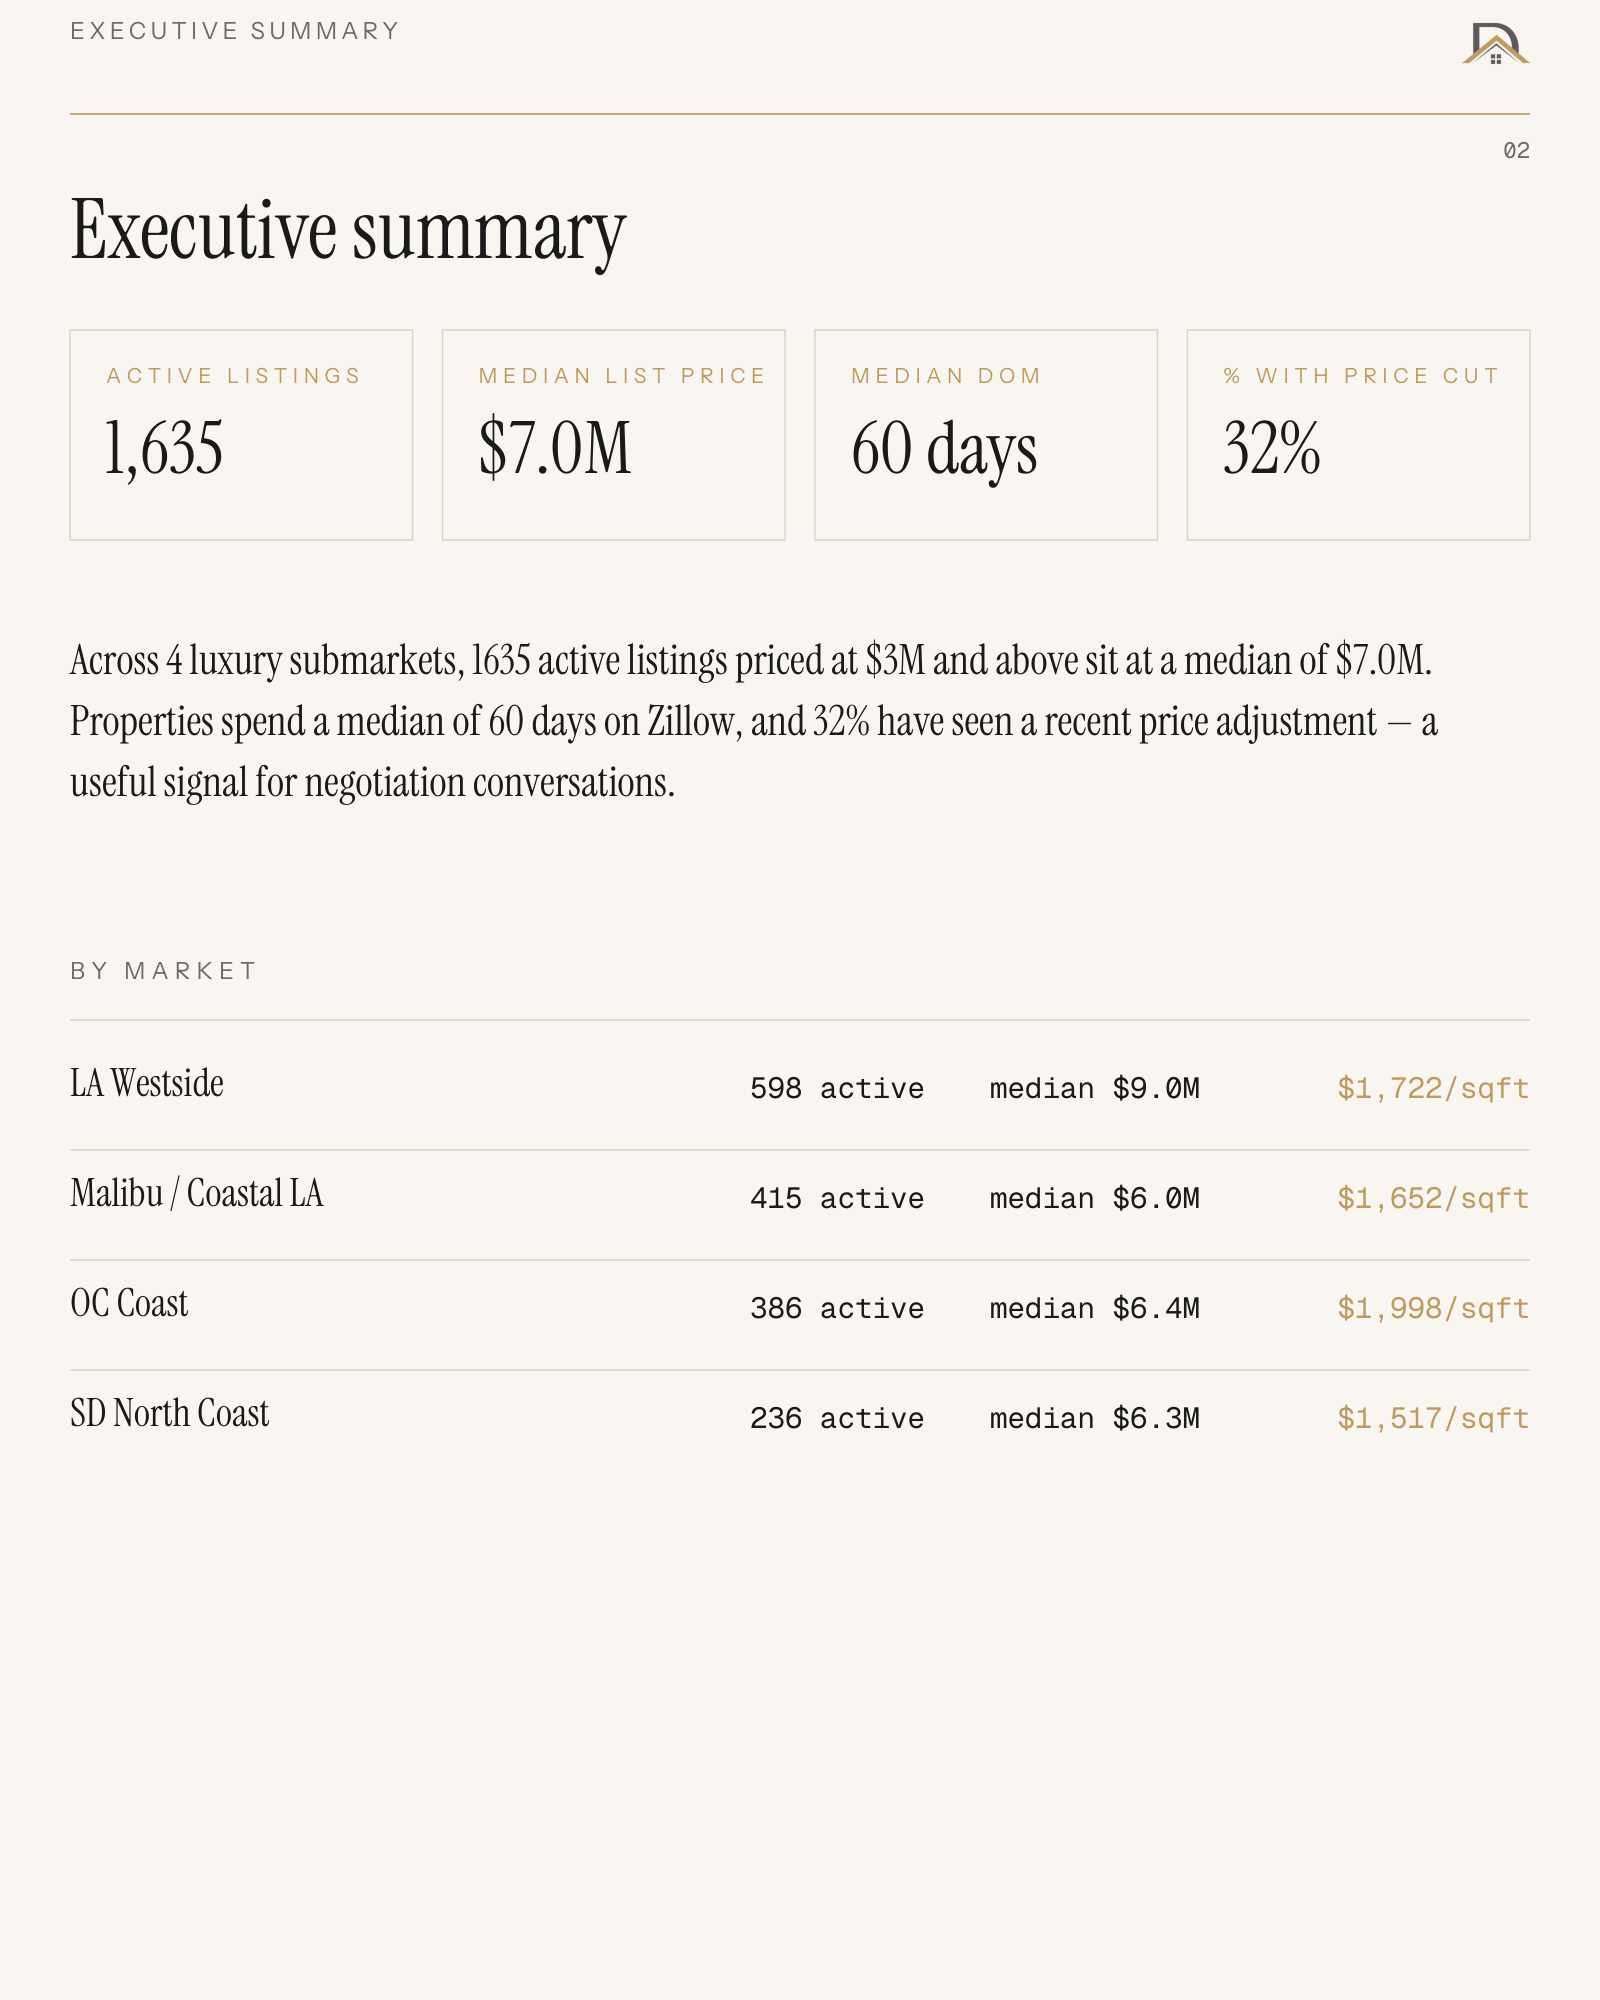
This briefing covers active listings priced at $3M and above across four coastal submarkets: LA Westside, Malibu / Coastal LA, OC Coast, and SD North Coast. Data pulled from Zillow on April 26, 2026.
Across all four markets, 1,635 properties are actively listed with a median ask of $7.0M. The typical listing has been sitting for 60 days, and nearly a third have already had a price adjustment. That 32% price-cut rate is worth noting — at this price tier, sellers are still negotiating.
Cross-Market Comparison
Higher price-per-square-foot generally signals a stronger seller position. OC Coast leads all four markets on that metric — not because it has the highest median price, but because its homes are priced more densely. SD North Coast has the lowest $/sqft and the fastest median DOM at 47 days, suggesting stronger relative absorption at that end of the spectrum.
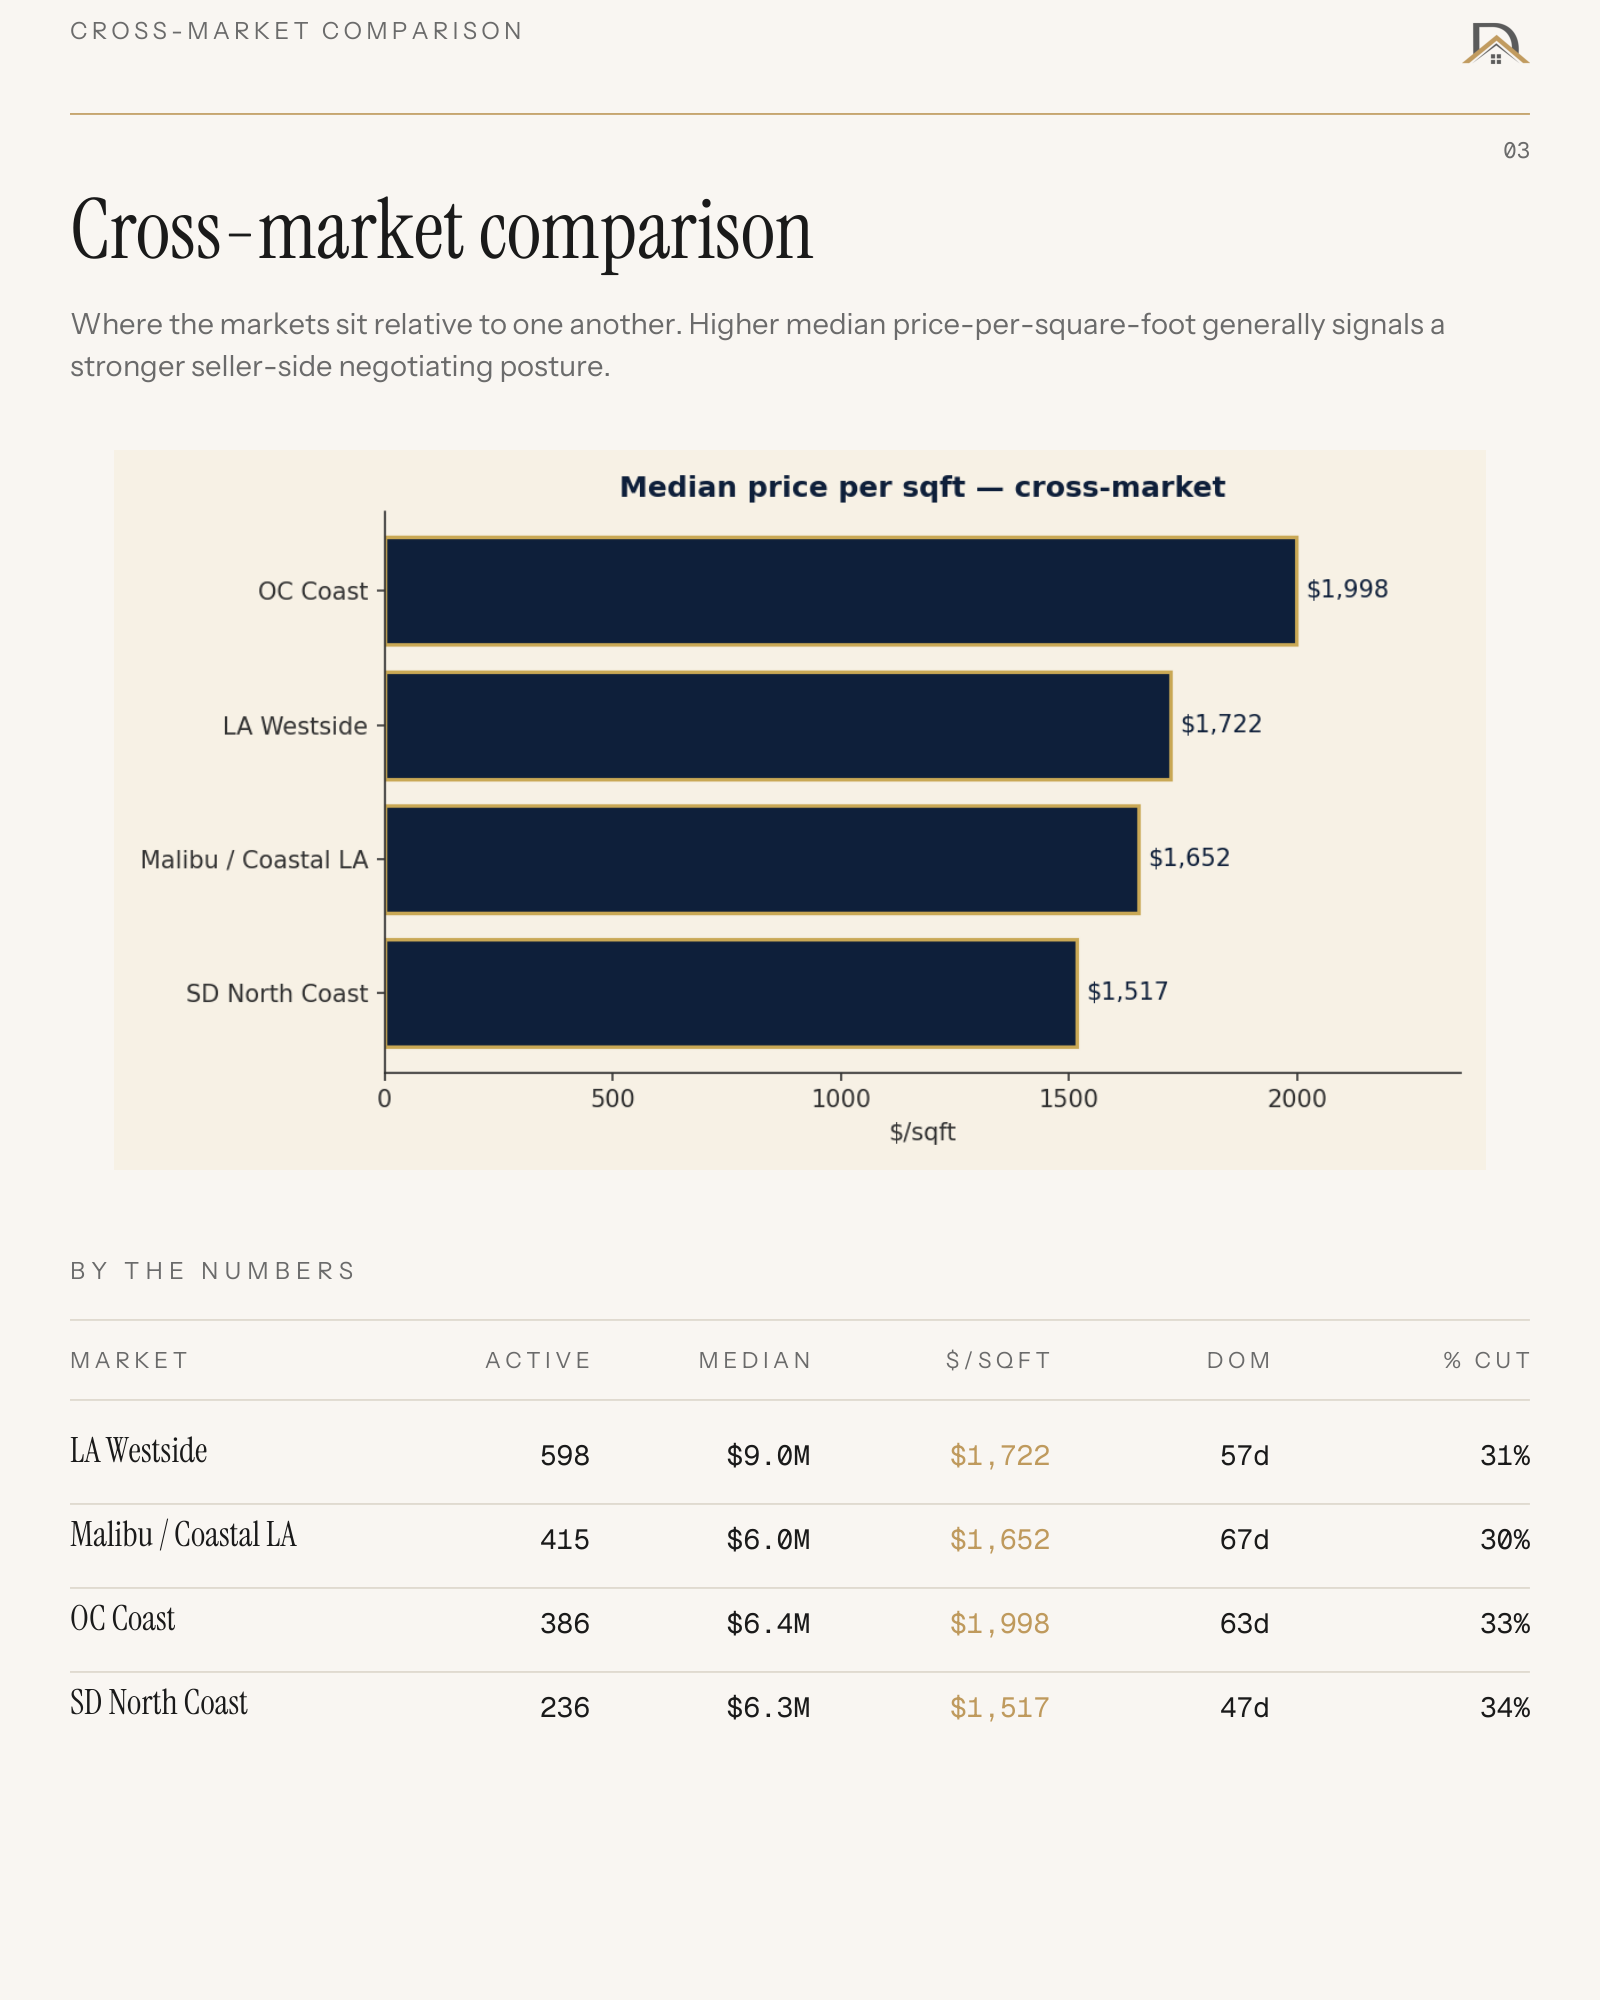
Median price per sqft across four SoCal luxury submarkets. Source: Zillow via Apify, April 26, 2026.
| Market | Active | Median | $/sqft | DOM | % Cut |
|---|---|---|---|---|---|
| LA Westside | 598 | $9.0M | $1,722 | 57d | 31% |
| Malibu / Coastal LA | 415 | $6.0M | $1,652 | 67d | 30% |
| OC Coast | 386 | $6.4M | $1,998 | 63d | 33% |
| SD North Coast | 236 | $6.3M | $1,517 | 47d | 34% |
LA Westside
The largest submarket by listing count, with 598 active properties and a median of $9.0M. At $1,722/sqft, it lands in the middle of the four markets on density pricing. Roughly 31% of listings have had a price cut — and the inventory range is extraordinary, running from $3.1M up to a $170M listing in Bel Air.
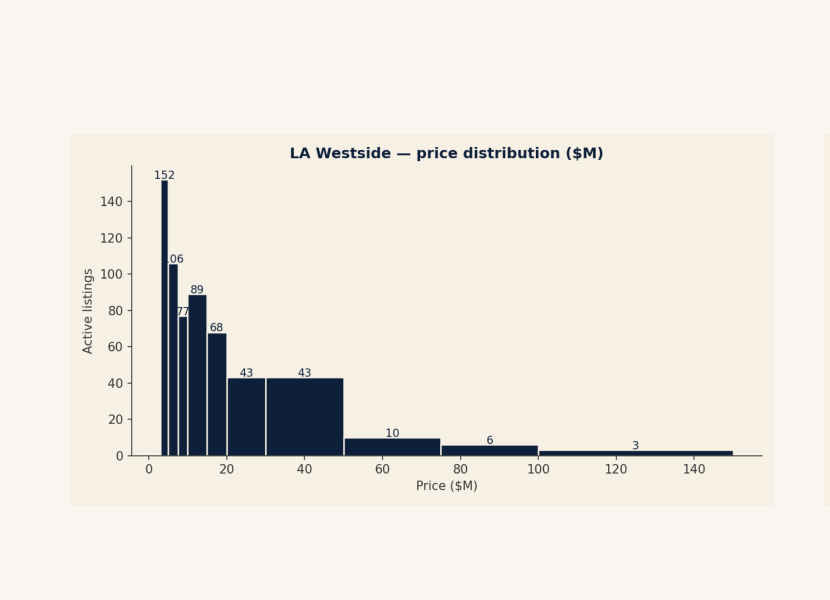
Price distribution ($M)
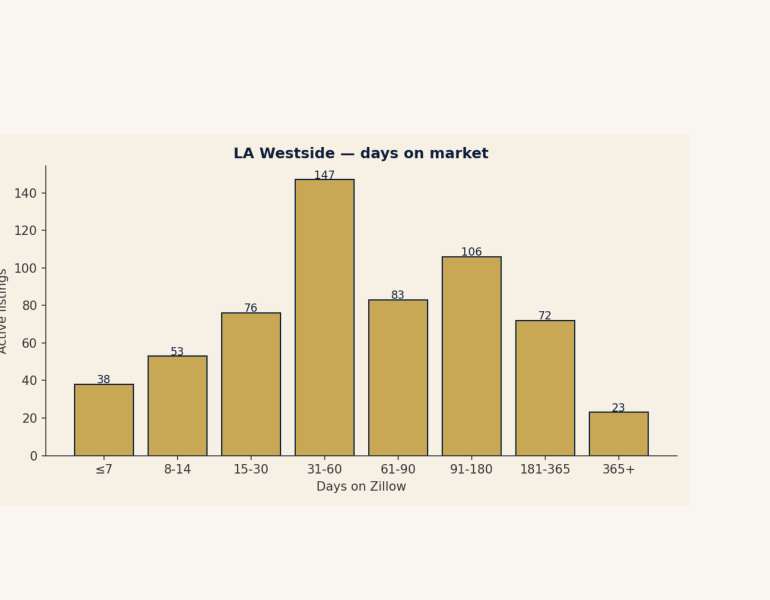
Days on market distribution
Inventory range: $3.1M – $170.0M. The $170M Bellagio Road estate (7bd · 20ba · 28,725 sqft) was listed just one day before the run date — the widest single-market price spread in this briefing.
Malibu / Coastal LA
415 active listings with a $6.0M median and the longest median DOM in the group at 67 days. The Malibu market tends to attract a specific buyer profile, and that specificity shows — absorption is slower here than anywhere else in the briefing. Price cuts at 30% are the lowest across the four markets, which suggests sellers aren’t yet capitulating on price despite the longer hold times.
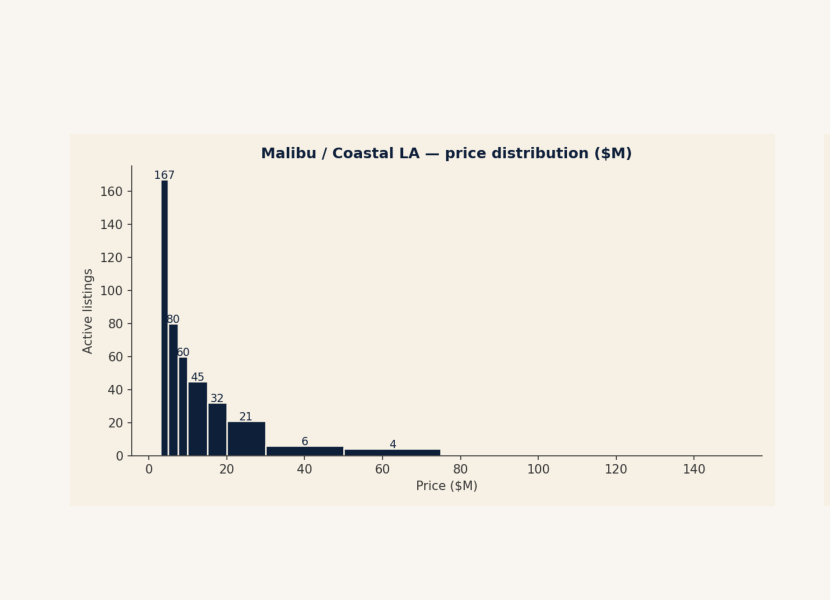
Price distribution ($M)
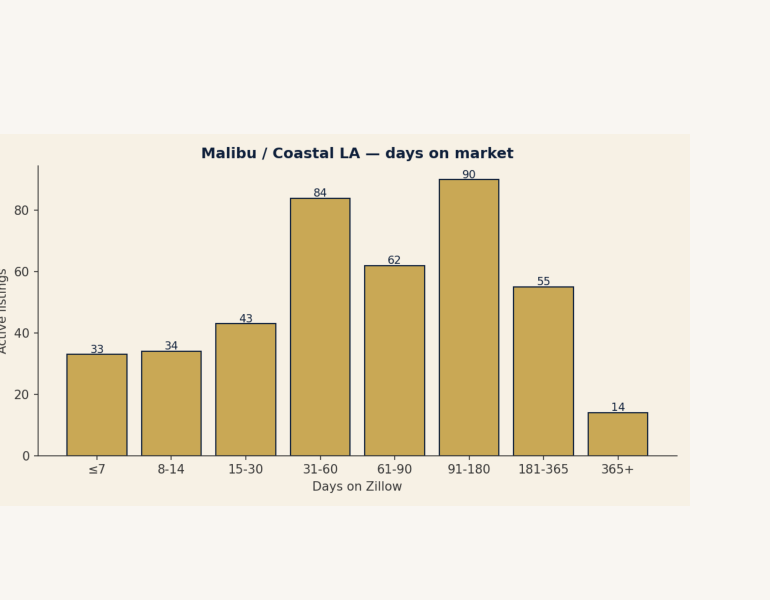
Days on market distribution
OC Coast
386 active listings at a $6.4M median — and the highest price-per-square-foot of all four markets at $1,998/sqft. That’s nearly $500/sqft more than SD North Coast. Laguna Beach and Newport Coast continue to command premium density pricing. At 33% with price cuts and a 63-day median DOM, OC Coast sits in the middle of the pack on both negotiation signals.
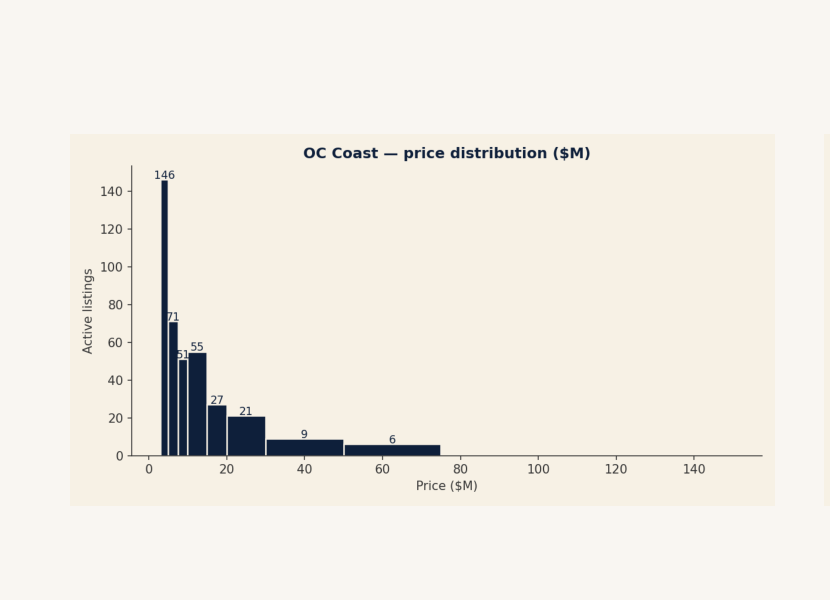
Price distribution ($M)
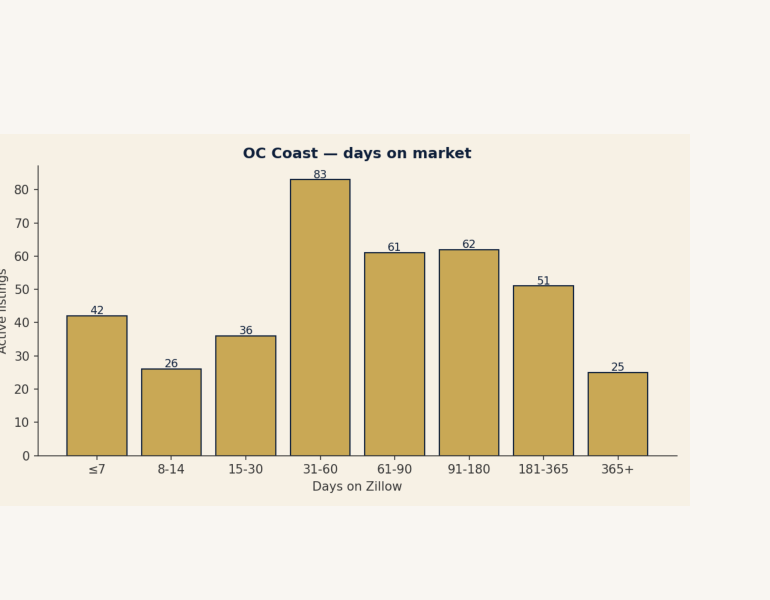
Days on market distribution
SD North Coast
The smallest submarket by active count at 236 listings, but it moves the fastest — 47-day median DOM is the shortest in the group. The price-per-sqft at $1,517 reflects more land-heavy inventory in areas like Rancho Santa Fe and Del Mar, where lot size often matters more than built square footage. One listing in Del Mar at 929 Border Ave has been on Zillow for 6,831 days — likely a data artifact, but worth noting.
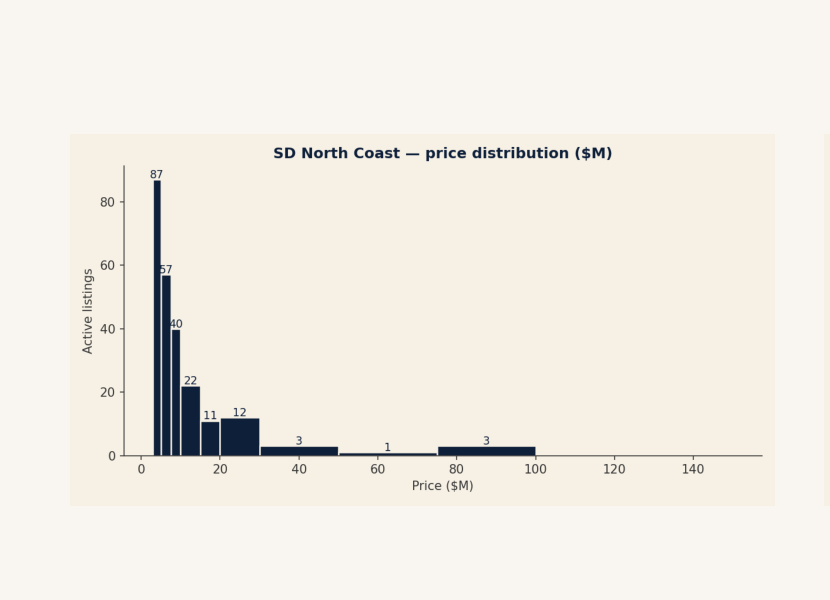
Price distribution ($M)
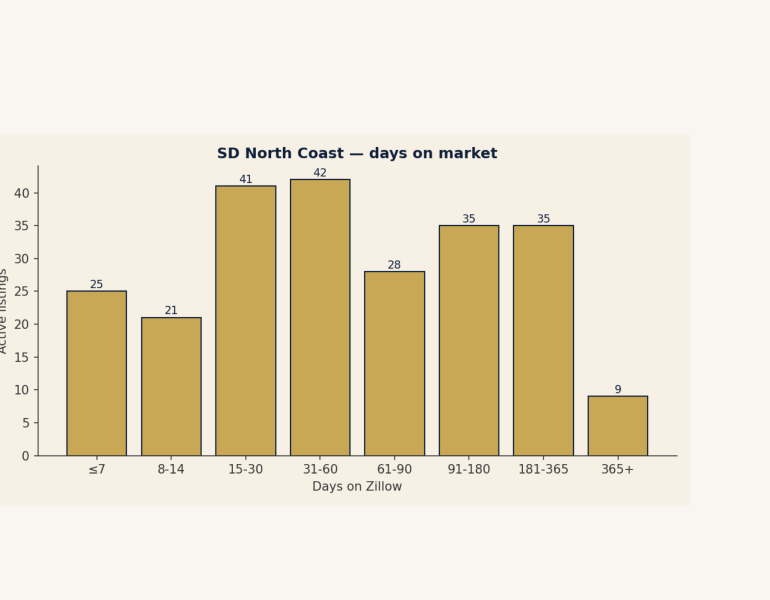
Days on market distribution
What’s Moving
Biggest Price Cuts
- 1261 Angelo Dr, Beverly Hills · LA Westside $135.0M ↓ $40.0M
- 729 Bel Air Rd, Los Angeles · LA Westside $95.0M ↓ $25.0M
- 859 Woodacres Rd, Santa Monica · LA Westside $88.0M ↓ $22.0M
- 1005 Bel Air Ct, Los Angeles · LA Westside $29.5M ↓ $19.5M
All four of the largest price reductions are concentrated on the LA Westside — which also happens to be the market with the highest median. That pattern tracks: at the ultra-high end, the gap between initial ask and buyer expectations tends to be widest.
Longest on Market
- 929 Border Ave, Del Mar · SD North Coast $76.0M 6,831 days
- 1740 Summitridge Dr, Beverly Hills · LA Westside $6.5M 3,595 days
- 2800 Ocean Front, Laguna Beach · OC Coast $15.5M 1,804 days
- 34412 Saint of the Green Lant, Dana Point · OC Coast $5.0M 1,541 days
Run date: April 26, 2026. Data source: Zillow listings via Apify (maxcopell/zillow-zip-search actor). Filter: For-sale listings asking $3,000,000 and above.
ZIP clusters — LA Westside: 90210, 90077, 90049, 90272, 90024, 90402 · Malibu / Coastal LA: 90265, 90266, 90254, 90274, 90275 · OC Coast: 92625, 92660, 92651, 92657, 92662, 92629 · SD North Coast: 92037, 92014, 92067, 92075.
Days-on-market reflects time listed on Zillow, not MLS list date. Validate with MLS before any client-facing use.
One Tool Worth Knowing About Right Now
Most of us looking at these numbers aren’t buying a $7M home. That’s fine — it’s not really the point of tracking the market. The point is understanding it, which takes time and a lot of reading.
If you’ve been meaning to work through more investing and real estate content but struggle to find the sitting-down-with-a-book kind of time, Audible is genuinely useful. The free trial gives you 30 days of Premium Plus access, including credits you can use immediately. It works well for anyone who has commutes, walks, or any other dead time to fill.
A few titles worth starting with if this blog is your kind of content:
- The Psychology of Money
- The Wealthy Renter
- Real Estate Investing Gone Bad
- The Intelligent Investor
The trial is free, there’s no commitment if it doesn’t stick, and the content library is broad enough to be useful for where you are in your investing journey.
Try Audible free for 30 days →This post contains an affiliate link. If you sign up through the link above, a small commission comes back this way — at no cost to you. The recommendation stands on its own regardless.