Four Markets, One Coast
Malibu, Manhattan Beach, Palos Verdes Estates, and Rancho Palos Verdes share a coastline but not a market. The spread in median list price across these four ZIP codes runs from $4.5 million to $7.3 million. The spread in price per square foot runs from $1,071 to $1,979. Those gaps say more than the addresses do. This briefing walks through what the numbers show — where pricing power sits, where it is slipping, and where 391 active listings are moving at very different speeds.

At a glance · side-by-side
Malibu leads on every price metric. Its median list price of $7.3 million is $1.9 million above Manhattan Beach and nearly $3 million above Rancho Palos Verdes. Manhattan Beach carries the fastest velocity in the group — median 37 days on market, the only market under 40 days. Palos Verdes Estates shows the highest rate of seller concessions at 39 percent, more than double Rancho Palos Verdes at 19 percent. The leader in each row below is underlined in gold.
Where the prices sit
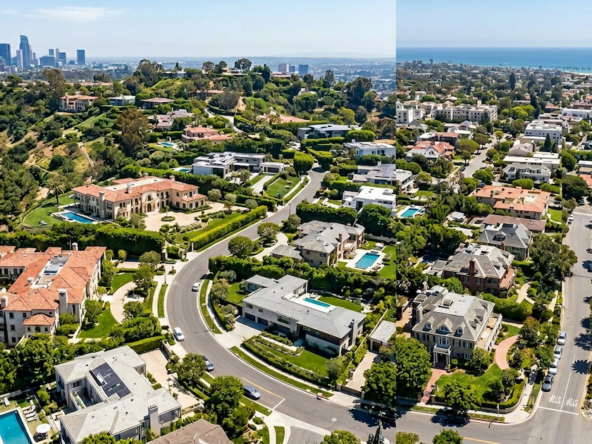
The bar chart makes the tier structure plain. Malibu stands alone. The $7.3 million median reflects a market anchored by significant land positions — Carbon Beach frontage, Point Dume compounds, canyon estates above PCH — that have no equivalent elsewhere on this stretch of coast. Inventory runs from $3.0 million to $74.5 million, a range that shows how much variety the 90265 ZIP code holds.
Manhattan Beach and Palos Verdes Estates are effectively at par: $5.4 million and $5.3 million respectively, a difference of $100,000 that should not be read as a market signal. Rancho Palos Verdes trails at $4.5 million. Both Palos Verdes markets are narrower in range — topping at $28.9 million and $17.4 million — which means fewer outliers pulling the upper end.

What buyers actually pay per foot
Headline median price and price per square foot tell different stories here. Manhattan Beach at $1,762 per square foot is closer to Malibu ($1,979) than the $1.9 million gap in median price would suggest. The two markets carry similar per-foot premiums. What separates them on median price is lot configuration, square footage, and the specific character of what is being sold — not a structural repricing.
The real story is the cliff. Palos Verdes Estates at $1,129 per square foot and Rancho Palos Verdes at $1,071 sit $633 and $691 below Malibu respectively. These markets offer substantially more physical space at a lower per-foot cost. A buyer comparing a $5.3 million home in Palos Verdes Estates to a $5.4 million home in Manhattan Beach is buying a different product — likely more square footage, a different topography, and a different commute profile.

How long things sit
Manhattan Beach moves. Its median 37 days on market is the lowest of the four and the only number under 40. That is a signal of clear demand and accurate pricing — homes are finding buyers without extended negotiation periods. The 27 percent rate of recent price cuts is the second-lowest in the group, consistent with sellers entering at defensible numbers.
Malibu’s 82-day median is the highest, though not an alarm signal at this price point. Luxury coastal inventory at $7.3 million median historically requires more time and a more selective buyer pool. The 30 percent cut rate suggests active repricing is happening — sellers adjusting rather than withdrawing. Rancho Palos Verdes at 68 days and 19 percent cuts reads as a patient market, not a distressed one. Palos Verdes Estates at 57 days with a 39 percent cut rate is the one market where supply and demand appear most misaligned.

The four neighborhoods, one at a time
Malibu is the largest and most varied of the four. Its 263 active listings span from $3.0 million entry points to $74.5 million at the top — a 25:1 ratio that reflects how many different Malibus exist within a single ZIP code. The $7.3 million median is shaped by the weight of oceanfront and bluff-top inventory, where price is determined as much by water access and view angle as by interior square footage. Median days on market at 82 signals a deliberate buyer pool; these transactions take time. The 30 percent cut rate shows sellers are actively recalibrating, particularly on listings that came to market before the broader price adjustment. Three in ten properties have already made at least one reduction.
Malibu


Manhattan Beach is the velocity market of this group. At 37 median days on market, homes are absorbing at roughly half the pace of Malibu. The 55 active listings make it the second-most liquid market by count, and its $1,762 median price per square foot is near Malibu’s level — evidence that the per-foot premium buyers assign to Manhattan Beach is genuine. The price range ($3.1 million to $25.0 million) is narrower than Malibu, which means less volatility at the extremes and fewer headline outliers. A 27 percent cut rate, the second-lowest here, indicates pricing discipline at list. Buyers waiting for softening may not find much of it.
Manhattan Beach


Palos Verdes Estates is the tension market. Its median list price of $5.3 million and 46 active listings place it at reasonable depth, but the 39 percent rate of recent price cuts is the highest in this analysis — meaning sellers have had to move on their ask more aggressively than anywhere else. At 57 median days on market, inventory is not sitting still, but it is not moving quickly either. The per-foot cost of $1,129 reflects the market’s particular character: large bluff-top homes with panoramic views, canyon-facing lots, and a topography that demands context. If you are buying for land value and view, the math looks different than if you are comparing to walk-to-sand alternatives.
Palos Verdes Estates


Rancho Palos Verdes is the smallest and most patient market here, with 27 active listings and a median 68 days on market. The 19 percent rate of recent cuts is the lowest of the four — sellers are holding. Median list price of $4.5 million at $1,071 per square foot positions this as the most accessible entry in the group, though accessible is relative at these numbers. The $3.2 million to $17.4 million range is the tightest of the four, which tends to mean fewer surprises at either extreme. Buyers sensitive to per-foot value will find more of it here than in any other market in this briefing.
Rancho Palos Verdes


Where seller motivation is showing
The six largest price reductions across the four neighborhoods are all in the ultra-high end — the smallest cut in this table is $2.7 million. Three of the six are on Pacific Coast Highway in Malibu, where $30 million-plus asking prices are being repositioned by $5.0 million to $6.5 million. The Palos Verdes Estates entry, a $28.9 million property with a $4.2 million reduction, is the market’s single most significant concession signal. These are not distress events; they are sellers recalibrating to what the buyer pool for nine-figure coastal real estate will actually support.
| Address | Current price | Cut | |
|---|---|---|---|
| Malibu24834 Pacific Coast Hwy, Malibu, CA 90265 | $33.0M | −$6.5M | View ↗ |
| Malibu29754 Baden Pl, Malibu, CA 90265 | $28.9M | −$5.7M | View ↗ |
| Malibu26946 Pacific Coast Hwy, Malibu, CA 90265 | $34.0M | −$5.0M | View ↗ |
| Palos Verdes Estates1129 Via Mirabel, Palos Verdes Estates, CA 90274 | $28.9M | −$4.2M | View ↗ |
| Malibu18904 Pacific Coast Hwy, Malibu, CA 90265 | $9.5M | −$3.0M | View ↗ |
| Rancho Palos Verdes3300 Palos Verdes Dr W, Rancho Palos Verdes, CA 90275 | $13.3M | −$2.7M | View ↗ |
What has been sitting
Six listings across these four neighborhoods have been active for more than 500 days. The leader — 5878 Deerhead Rd in Malibu at $9.5 million — has been on Zillow for 656 days, nearly 22 months. The Palos Verdes Estates entry at 2521 Novato Pl ($6.8 million, 618 days) has been on the market for nearly two years. Extended time on market at these prices does not always indicate a distressed seller, but it does indicate a pricing or positioning thesis that the market has yet to validate. Four of the six entries are in Malibu’s 90265, where the upper end of inventory has been the most resistant to clearing.
| Address | Price | Days on Zillow | |
|---|---|---|---|
| Malibu5878 Deerhead Rd, Malibu, CA 90265 | $9.5M | 656 days | View ↗ |
| Palos Verdes Estates2521 Novato Pl, Palos Verdes Peninsula, CA 90274 | $6.8M | 618 days | View ↗ |
| Malibu22065 Pacific Coast Hwy #3, Malibu, CA 90265 | $4.0M | 588 days | View ↗ |
| Malibu5024 Carbon Beach Ter, Malibu, CA 90265 | $9.9M | 586 days | View ↗ |
| Malibu5637 Busch Dr, Malibu, CA 90265 | $8.8M | 556 days | View ↗ |
| Palos Verdes Estates50 Eastfield Dr, Rolling Hills, CA 90274 | $6.0M | 519 days | View ↗ |